Quarter Three 2023: The SSG Jobs Report Review
KEY TAKEAWAYS:
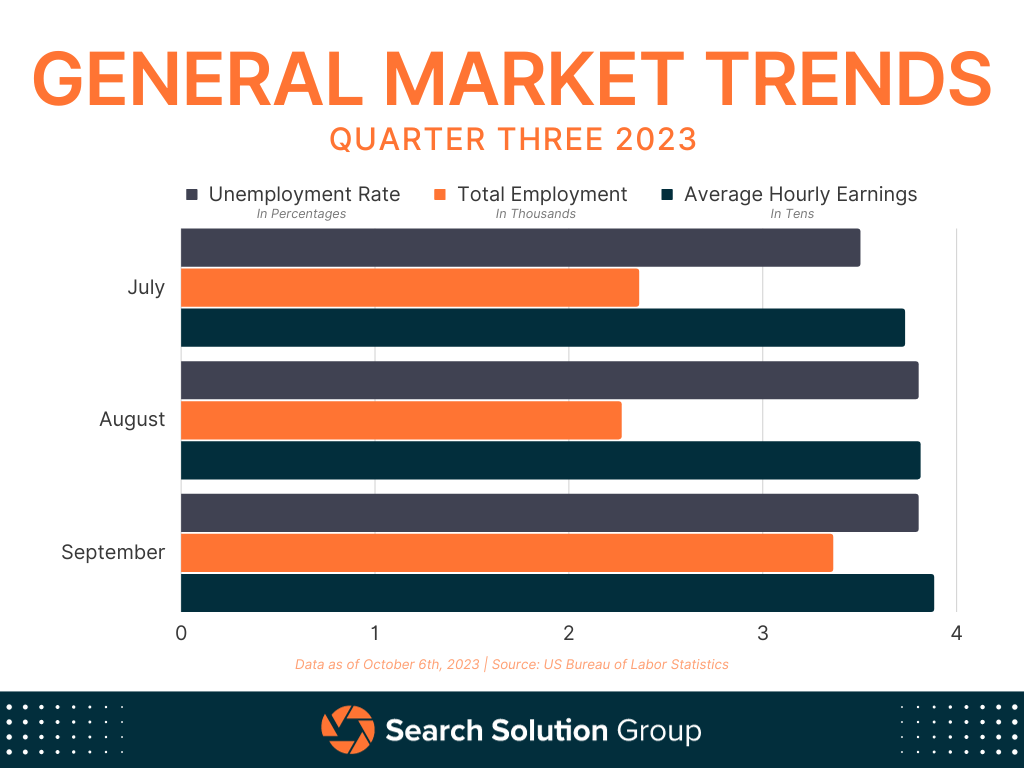
- Unemployment Stability: The national unemployment rate for Q3 was relatively steady at 3.7%, a slight increase from the 3.5% in Q2. This stability contrasts with the volatility seen during the COVID-19 pandemic, with yearly rates ranging between 3.4% and 3.8%.
- Nonfarm Payroll Growth: September 2023 saw a significant addition of 336,000 jobs, contributing 849,000 new jobs in Q3. The US Total Nonfarm Payroll now stands at 156.87 million, up from 153.68 million year-on-year.
- Rising Hourly Earnings: Average hourly earnings have consistently risen, reaching a historical high of $33.88 by September from $33.73 in July, highlighting positive wage growth trends.
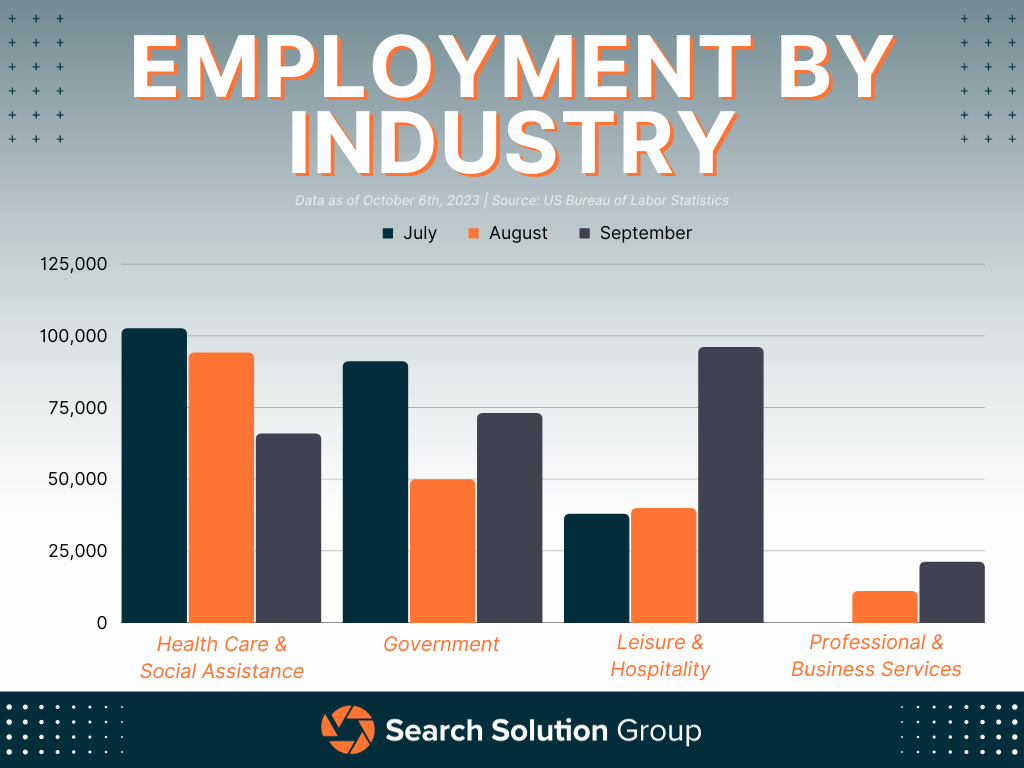
- Sector Performance: While the Health Care & Social Assistance sectors remained dominant in job creation (262,000 jobs in Q3), the Professional and Business Services sector saw a concerning drop, adding only 3,000 jobs, compared to 130,000 in Q2.
As we look to the fourth quarter (Q4) of 2023, the Employment Situation Jobs Reports from the third quarter (Q3), curated by the Bureau of Labor Statistics (BLS), offer key insights into the job market’s direction. These reports reveal industry job trends, wage averages, and sought-after hiring sectors, giving a comprehensive view of the labor landscape.
These reports not only reflect the U.S. economy’s health but also influence policy decisions, financial markets and provide the public with essential job and economic trends.

General Market Trend Breakdown
The national unemployment landscape remained largely steady in Q3 of 2023. The average unemployment rate was recorded at 3.7%, slightly up from the 3.5% rate observed in Q2. Within Q3, both August and September saw identical unemployment rates of 3.8%. This marks the peak since February 2022. However, compared to the unstable periods during and immediately after the COVID-19 pandemic, the unemployment rate over the past year has been relatively stable, ranging between 3.4% and 3.8%.
In terms of nonfarm payroll employment, September 2023 witnessed a significant increment with 336,000 jobs added. This is notably higher than the number in August, especially after the BLS updated seasonal adjustment factors, leading to an increase of over 110,000 jobs. For the entirety of Q3, the average monthly job addition stood at 283,000, culminating in a total of 849,000 new positions. As of now, the US Total Nonfarm Payroll stands at 156.87 million, marking an increase from 156.54 million in the preceding month and up from 153.68 million year-on-year.
One of the noteworthy observations from the current economic indicators is the consistent rise in average hourly earnings. In Q2, there was a minor increase from $33.36 in May to $33.46 in June. The upward trajectory continued in Q3, with average hourly earnings growing from $33.73 in July to $33.88 by September. Currently, this rate represents the highest recorded average hourly earnings in U.S. history.
In summary, while unemployment rates have seen minor fluctuations, the overall employment landscape, especially in terms of nonfarm payroll employment and hourly earnings, has demonstrated promising trends for the U.S. economy.
Industry Focused Digest
As part of their monthly analysis, the BLS highlights the selected industries that have experienced significant job growth, providing insights into the specific sectors within these industries that are witnessing a rise in employment. Drawing from the three reports from the third quarter, notable industry highlights are worth mentioning.

The third quarter of the year witnessed the Health Care & Social Assistance sectors persisting in their job creation dominance, mirroring the previous quarter’s trends. These sectors collectively contributed to the influx of 262,000 new employment opportunities. A monthly breakdown reveals a steady decline in the number of jobs added, with July witnessing over 100,000, reducing to over 94,000 in August and further to just over 87,000 in September. However, these sectors remained the leading source of new jobs despite this sequential decline.
The Government sector exhibited a remarkable performance, with a total of 214,000 new jobs added in the third quarter. This robust figure exceeded the prior quarter’s additions significantly. A monthly analysis after BLS seasonal adjustments reveals the addition of 91,000 jobs in July, 50,000 in August, and 73,000 in September, averaging 71,300 new jobs per month. In comparison, Q2 saw a total of 145,000 new job creations, underscoring the substantial growth in Q3.
In a comparative analysis between Q2 and Q3, the Leisure and Hospitality industry exhibited the most pronounced shift. While Q2 recorded a modest increase with 58,000 job additions, Q3 demonstrated substantial growth with over 174,000 positions added. This progression aligns more closely with the previous year’s trends, where the average monthly job addition was just under 100,000. Examining Q3 more closely reveals a consistent upward trend: July reported an addition of 38,000 jobs, August contributed 40,000, and September culminated with 96,000 new positions.
A concerning revelation of Q3 lies in the Professional and Business Services sector’s performance. The sector saw a net addition of only 3,000 jobs, a distinct decline compared to Q2’s 130,000. This was primarily attributed to July’s unexpected loss of 29,000 jobs, which was revealed after the BLS’s seasonal adjustment. August and September’s combined addition of 32,000 jobs barely offset this loss, averaging a mere 1,000 new jobs monthly.
The Q3 employment landscape presented a mix of encouraging and concerning trends. While the Health Care & Social Assistance industries remain to be formidable in job creation, a noticeable monthly decline prompts close monitoring. The Government sector’s commendable performance and the Leisure and Hospitality industry’s recovery are positive indicators of the labor market’s resilience. However, the unexpected downturn in the Professional and Business Services sector underscores employment trends’ complex, dynamic nature. Continuous, meticulous analysis is essential to navigate and respond to these evolving patterns effectively.
Upcoming BLS Reports for the Third Quarter
The job market is consistently evolving with new developments and trends. While the monthly Employment Situation Jobs Report gives us an initial look, there’s still much more to uncover. In the upcoming months, the Bureau of Labor Statistics will be rolling out a series of detailed reports about the third quarter’s job dynamics. To stay informed and ahead of the curve, it’s a good idea to keep an eye on these forthcoming insights.
Wednesday, October 18th – State Job Openings and Labor Turnover for August 2023
Friday, October 20th – State Employments and Unemployment for September 2023
Tuesday, October 31st – Employment Cost Index for Third Quarter 2023
Wednesday, November 1st – Job Openings and Labor Turnover Survey for September 2023
Thursday, November 2nd – Productivity and Costs for Third Quarter 2023
Monday, November 20th – State Job Openings and Labor Turnover for September 2023


