As we venture into Quarter 2 of the year, it’s an excellent opportunity to reflect on the valuable insights gleaned from the Employment Situation Jobs Report Q1 2023, published by the Bureau of Labor Statistics (BLS). The revelations and patterns observed in this initial quarter lay the groundwork for the trajectory of the job market in the foreseeable future, making it a critical report to analyze. From outlining industry trends among job openings and average wages to exploring popular sectors for hiring across regions — here’s your comprehensive guide on understanding exactly where the current labor market stands following this past quarter.
By utilizing two unique surveys, the household and establishment surveys, the BLS can paint a detailed picture of the current state of employment. The household survey dives deep into the demographics of the labor force, examining unemployment rates and workforce participation. Meanwhile, the establishment survey analyzes nonfarm industries, including employment rates, earnings, and hours worked.
General Market Trend Breakdown
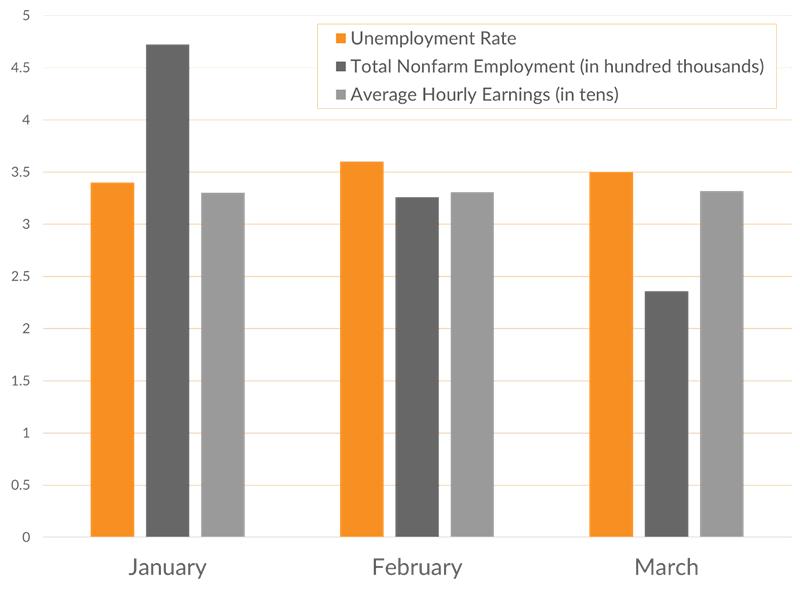
The national unemployment rate in Q1 averaged about 3.5% – around where the rates were for the first quarter last year as well. January was the lowest of the months, with a 3.4% rate, while February increased to 3.6% as March held steady at 3.5%. The unemployment rate has seen little movement since early 2022. This 3.5% rate is also roughly where unemployment was just before the start of the COVID-19 pandemic back in 2020.
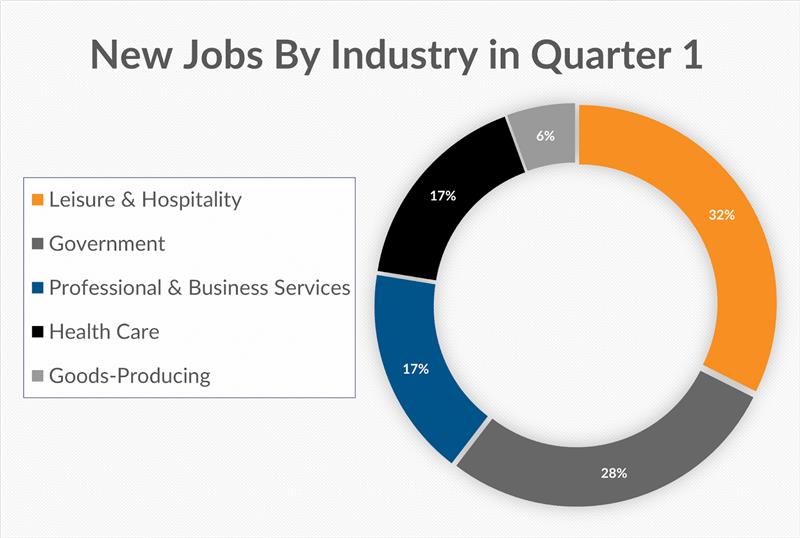
Total nonfarm payroll employment increased by 236,000 in March, compared to the average monthly gain of 334,000 over the past six months. In Q1 specifically, January had a payroll gain of 472,000, February with 326,000, and an even lower increase in March, reaching 236,000. Most of the continued trend in employment over the quarter has been within leisure & hospitality, government, professional & business services, and health care.
Despite a stable compensation trend throughout the last quarter, there hasn’t been any significant rise in average hourly earnings presented in the jobs report Q1 2023, which have only increased by a modest 0.48% since January. In comparison, the past year saw a commendable growth rate of 4.2% in earnings overall.

Industry-Focused Digest
In the jobs report Q1 2023, the Bureau of Labor Statistics has provided valuable insights into the employment trends across various industries. From the latest reports, it is clear that specific sectors have maintained their growth trajectory in the early months of the year. Here are some noteworthy highlights from these industries:
Leisure & Hospitality added 261,000 jobs in the first quarter, averaging roughly 87,000 per month. Compared to the previous six months, these rates are slightly lower than they used to be, averaging a monthly gain of 95,000 within the past six months. In general, jobs in Leisure & Hospitality have decreased progressively over the first quarter, likely due to the end of the holiday season, with January adding the highest number of jobs in the industry so far this year at 99,000, February adding 90,000 and March lowest at 72,000 jobs. Though these trends are lowering thus far this year, the industry continues to add the highest number of jobs to the market.
Government employment increased by 226,000 jobs in Q1. However, compared to the prior six months, new jobs have remained stagnant. Though government jobs have decreased over the first quarter from January until now, the industry remains a high job producer compared to other sectors.
Professional & Business Services also continued to increase employment in the first quarter. The average number of jobs for the quarter was 46,000 per month, with 138,000 jobs added. The trend of rising employment in the professional, scientific, and technical services fields has shown no signs of slowing down within the industry. As a result, these fields within professional and business services have continued to grow throughout the first quarter of 2023.
In the Health Care field, 136,000 jobs were added in this first quarter. In the past quarter, the average amount of new jobs added per month has come in at around 54,000, which has steadily declined at the beginning of this year as each month has gradually added fewer and fewer jobs. Some areas of the industry, such as home health care services, hospitals, and residential care, have fluctuated but are increasing overall, despite the decline in added jobs throughout the quarter.

Conclusion
Overall, the jobs report Q1 2023 revealed a steady outlook as businesses recover from the pandemic. Several areas saw gains in job growth, with hospitality and travel leading the way regarding economic activity. While some sectors face the headwinds of uncertainty, the overall picture appears encouraging for those seeking employment opportunities amidst this continued global recovery stage.
Upcoming BLS Reports for First Quarter
The job market can be unpredictable, and while the monthly Employment Situation Jobs Report sheds some light on it, there is still more information and stats to come. The Bureau of Labor Statistics is slated to release a variety of reports over the next few months, containing valuable information on the first quarter. Be sure to take note of these selected releases to stay informed on the latest developments!
Friday, April 21st – State Employment and Unemployment for March 2023
Friday, April 28th – Employment Cost Index for First Quarter 2023
Tuesday, May 2nd – Job Openings and Labor Turnover Survey for March 2023
Thursday, May 4th – Productivity and Costs for First Quarter 2023
Wednesday, May 17th – State Job Openings and Labor Turnover for March 2023


